PyGraphistry: Leverage the power of graphs & GPUs to visualize, analyze, and scale your data








PyGraphistry is an open source Python library for data scientists and developers to leverage the power of graph visualization, analytics, AI, including with native GPU acceleration:
-
Python dataframe-native graph processing: Quickly ingest & prepare data in many formats, shapes, and scales as graphs. Use tools like Pandas, Spark, RAPIDS (GPU), and Apache Arrow.
-
Integrations: Connect to graph databases, data platforms, Python tools, and more.
| Category |
Connector Tutorials |
| Data Platforms, SQL & Logs |
     |
| Graph Databases |
     |
| Python Tools & Libraries |
      |
View all connectors →
-
Prototype locally and deploy remotely: Prototype from notebooks like Jupyter and Databricks using local CPUs & GPUs, and then power production dashboards & pipelines with Graphistry Hub and your own self-hosted servers.
-
Query graphs with GFQL: Use GFQL, the first fully vectorized dataframe-native graph query language with an open-source GPU runtime, to ask relationship questions that are difficult for tabular tools without requiring a database. It supports friendly Cypher syntax and declarative graph semantics through g.gfql("MATCH ..."), with the same execution model available on the current bound graph or remotely via g.gfql_remote([...]).
-
graphistry[ai]: Call streamlined graph ML & AI methods to benefit from clustering, UMAP embeddings, graph neural networks, automatic feature engineering, and more.
-
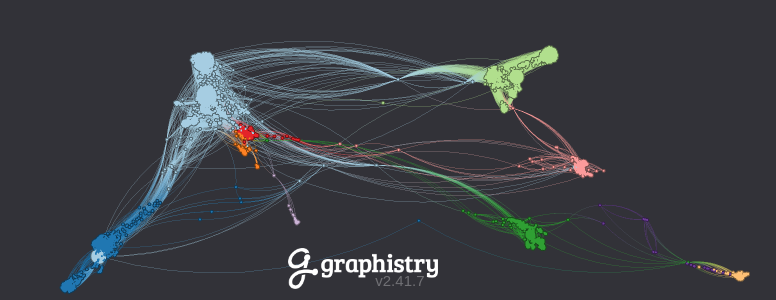
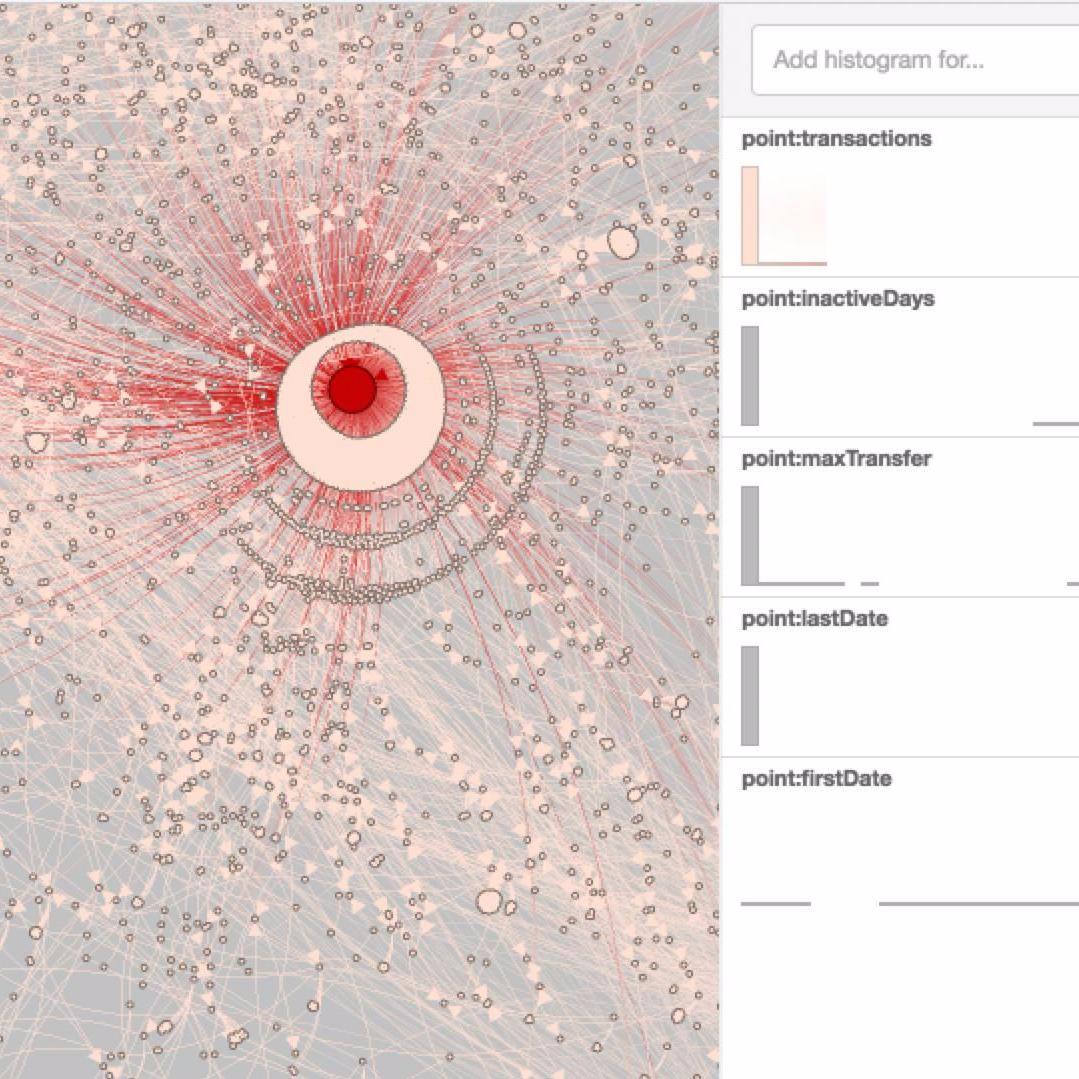
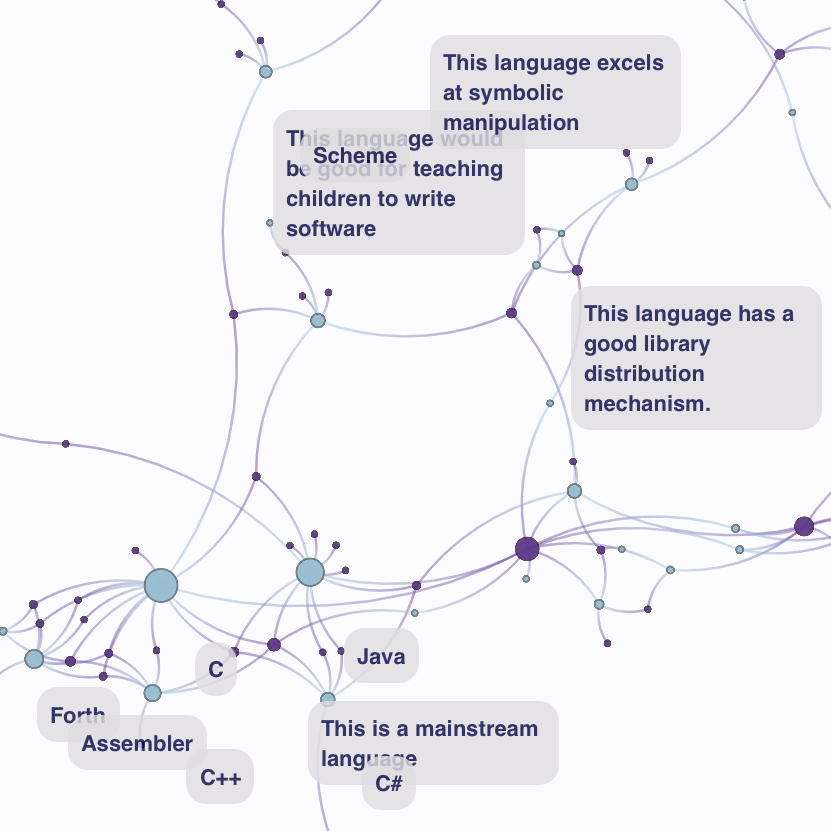
Visualize & explore large graphs: In just a few minutes, create stunning interactive visualizations with millions of edges and many point-and-click built-ins like drilldowns, timebars, and filtering. When ready, customize with Python, JavaScript, and REST APIs.
-
Columnar & GPU acceleration: CPU-mode ingestion and wrangling is fast due to native use of Apache Arrow and columnar analytics, and the optional RAPIDS-based GPU mode delivers 100X+ speedups.
From global 10 banks, manufacturers, news agencies, and government agencies, to startups, game companies, scientists, biotechs, and NGOs, many teams are tackling their graph workloads with Graphistry.
AI Assistant Integration
For LLM coding assistants (Claude Code, Cursor, Codex, etc.), install the official graphistry-skills package for better PyGraphistry code generation:
npx skills add graphistry/graphistry-skills
Skills improve AI success rates from ~50% to ~90% on PyGraphistry tasks by providing context-aware guidance for graph ETL, visualization, GFQL queries, and AI workflows.
Gallery
The notebook demo gallery shares many more live visualizations, demos, and integration examples
Install
Common configurations:
-
Minimal core
Includes: The GFQL dataframe-native graph query language, built-in layouts, Graphistry visualization server client
pip install graphistry
Does not include graphistry[ai], plugins
-
No dependencies and user-level
pip install --no-deps --user graphistry
-
GPU acceleration - Optional
Local GPU: Install RAPIDS and/or deploy a GPU-ready Graphistry server
Remote GPU: Use the remote endpoints.
For further options, see the installation guides
Visualization quickstart
Quickly go from raw data to a styled and interactive Graphistry graph visualization:
import graphistry
import pandas as pd

# Raw data as Pandas CPU dataframes, cuDF GPU dataframes, Spark, ...
df = pd.DataFrame({
    'src': ['Alice', 'Bob', 'Carol'],
    'dst': ['Bob', 'Carol', 'Alice'],
    'friendship': [0.3, 0.95, 0.8]
})

# Bind
g1 = graphistry.edges(df, 'src', 'dst')

# Override styling defaults
g1_styled = g1.encode_edge_color('friendship', ['blue', 'red'], as_continuous=True)

# Connect: Free GPU accounts and self-hosting @ graphistry.com/get-started
graphistry.register(api=3, username='your_username', password='your_password')

# Upload for GPU server visualization session
g1_styled.plot()
Explore 10 Minutes to Graphistry Visualization for more visualization examples and options
PyGraphistry[AI] & GFQL quickstart - CPU & GPU
CPU graph pipeline combining graph ML, AI, mining, and visualization:
from graphistry import n, e, e_forward, e_reverse

# Graph analytics
g2 = g1.compute_igraph('pagerank')
assert 'pagerank' in g2._nodes.columns

# Graph ML/AI
g3 = g2.umap()
assert ('x' in g3._nodes.columns) and ('y' in g3._nodes.columns)

# Graph querying with GFQL
g4 = g3.gfql([
    n(query='pagerank > 0.1'), e_forward(), n(query='pagerank > 0.1')
])
assert (g4._nodes.pagerank > 0.1).all()

# Upload for GPU server visualization session
g4.plot()
The automatic GPU modes require almost no code changes:
import cudf
from graphistry import n, e, e_forward, e_reverse

# Modified -- Rebind data as a GPU dataframe and swap in a GPU plugin call
g1_gpu = g1.edges(cudf.from_pandas(df))
g2 = g1_gpu.compute_cugraph('pagerank')

# Unmodified -- Automatic GPU mode for all ML, AI, GFQL queries, & visualization APIs
g3 = g2.umap()
g4 = g3.gfql([
    n(query='pagerank > 0.1'), e_forward(), n(query='pagerank > 0.1')
])
g4.plot()
Explore 10 Minutes to PyGraphistry for a wider variety of graph processing.
PyGraphistry documentation
Graphistry ecosystem
-
Graphistry server:
-
Graphistry client APIs:
-
Additional projects:
- Louie.ai: GenAI-native notebooks & dashboards to talk to your databases & Graphistry
- graph-app-kit: Streamlit Python dashboards with batteries-include graph packages
- cu-cat: Automatic GPU feature engineering
Community and support
Contribute
See CONTRIBUTING and DEVELOP for participating in PyGraphistry development, or reach out to our team






评论