


React.js wrapper for ApexCharts to build interactive visualizations in react.

Download and Installation
Installing via npm
npm install react-apexcharts apexcharts
Usage
Client-Side Usage (Traditional)
import Chart from 'react-apexcharts'
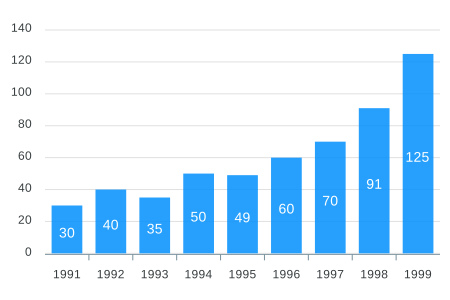
To create a basic bar chart with minimal configuration, write as follows:
class App extends Component {
  constructor(props) {
    super(props);

    this.state = {
      options: {
        chart: {
          id: 'apexchart-example'
        },
        xaxis: {
          categories: [1991, 1992, 1993, 1994, 1995, 1996, 1997, 1998, 1999]
        }
      },
      series: [{
        name: 'series-1',
        data: [30, 40, 35, 50, 49, 60, 70, 91, 125]
      }]
    }
  }
  render() {
    return (
      <Chart options={this.state.options} series={this.state.series} type="bar" width={500} height={320} />
    )
  }
}
This will render the following chart
How do I update the chart?
Simple! Just change the series or any option and it will automatically re-render the chart.

View this example on codesandbox
Server-Side Rendering (SSR) with Next.js App Router
New in v2.0.0: react-apexcharts now supports Server-Side Rendering with Next.js 13+ App Router using ApexCharts v5.5.0+.
Server Component (RSC)
Render charts on the server for faster initial page loads:
import Chart from 'react-apexcharts/server'

export default async function DashboardPage() {
  const series = [{
    name: 'series-1',
    data: [30, 40, 35, 50, 49, 60, 70, 91, 125]
  }]

  const options = {
    chart: { id: 'apexchart-example' },
    xaxis: { categories: [1991, 1992, 1993, 1994, 1995, 1996, 1997, 1998, 1999] }
  }

  return (
    <Chart
      type="bar"
      series={series}
      options={options}
      width={500}
      height={320}
    />
  )
}
With Client-Side Hydration
For interactive charts, combine server rendering with client-side hydration:
// app/dashboard/page.tsx (Server Component)
import Chart from 'react-apexcharts/server'
import ChartHydrate from './ChartHydrate'

export default async function DashboardPage() {
  const series = [{ data: [30, 40, 35, 50, 49, 60, 70] }]
  const options = { chart: { type: 'bar' }, xaxis: { categories: ['A', 'B', 'C', 'D', 'E', 'F', 'G'] } }

  return (
    <div>
      <Chart type="bar" series={series} options={options} width={500} height={300} />
      <ChartHydrate />
    </div>
  )
}
// app/dashboard/ChartHydrate.tsx (Client Component)
'use client'
import Hydrate from 'react-apexcharts/hydrate'

export default function ChartHydrate() {
  return (
    <Hydrate
      className="my-chart"
      clientOptions={{
        chart: {
          animations: {
            enabled: true,
            speed: 800
          }
        }
      }}
    />
  )
}
Client-Only Usage in Next.js
For client-only rendering (same as before):
'use client'
import Chart from 'react-apexcharts'

export default function ClientChart() {
  const options = {
    chart: { id: 'apexchart-example' },
    xaxis: { categories: [1991, 1992, 1993, 1994, 1995, 1996, 1997, 1998, 1999] }
  }

  const series = [{
    name: 'series-1',
    data: [30, 40, 35, 50, 49, 60, 70, 91, 125]
  }]

  return <Chart type="bar" series={series} options={options} />
}
Important: While updating the options, make sure to update the outermost property even when you need to update the nested property.
✅ Do this
this.setState({
  options: {
    ...this.state.options,
    xaxis: {
      ...this.state.options.xaxis,
      categories: ['X1', 'X2', 'X3']
    }
  }
})
❌ Not this
this.setState({
  options.xaxis.categories: ['X1', 'X2', 'X3']
})
Tree-Shaking (Smaller Bundles)
New in v2.1.0: Use the /core export to reduce your bundle size by only importing the chart types and features you actually use. This requires apexcharts >=5.10.1.
import Chart from 'react-apexcharts'
import Chart from 'react-apexcharts/core'
import 'apexcharts/bar'
import 'apexcharts/line'
import 'apexcharts/features/legend'
import 'apexcharts/features/annotations'
Full example:
import Chart from 'react-apexcharts/core'
import 'apexcharts/bar'
import 'apexcharts/features/legend'

export default function BarChart() {
  const series = [{ name: 'Sales', data: [30, 40, 35, 50, 49, 60, 70, 91, 125] }]
  const options = {
    chart: { id: 'bar-chart' },
    xaxis: { categories: [1991, 1992, 1993, 1994, 1995, 1996, 1997, 1998, 1999] }
  }

  return <Chart type="bar" series={series} options={options} width={500} height={320} />
}
The core variant also has SSR and hydration counterparts:
import Chart from 'react-apexcharts/core/server'
import Hydrate from 'react-apexcharts/core/hydrate'
Note for Vite users: Add resolve: { dedupe: ['apexcharts'] } to your vite.config.js to prevent Vite from loading two separate ApexCharts instances when mixing imports.
Props
| Prop |
Type |
Description |
| series |
Array |
The series is a set of data. To know more about the format of the data, checkout Series docs on the website. |
| type |
String |
line, area, bar, pie, donut, scatter, bubble, heatmap, radialBar |
| width |
Number or String |
Possible values for width can be 100%, 400px or 400 (by default is 100%) |
| height |
Number or String |
Possible values for height can be 100%, 300px or 300 (by default is auto) |
| options |
Object |
The configuration object, see options on API (Reference) |
| chartRef |
React.RefObject |
Pass a ref to get access to the underlying ApexCharts instance for imperative API calls |
How to call methods of ApexCharts programmatically?
Sometimes, you may want to call other methods of the core ApexCharts library, and you can do so on ApexCharts global variable directly
Example
ApexCharts.exec('reactchart-example', 'updateSeries', [{
  data: [40, 55, 65, 11, 23, 44, 54, 33]
}])
More info on the .exec() method can be found here
All other methods of ApexCharts can be called this way
What’s included
The published package includes the following files.
react-apexcharts/
├── dist/
│   ├── react-apexcharts.cjs.js          # CommonJS (default import)
│   ├── react-apexcharts.esm.js          # ES Module (default import)
│   ├── react-apexcharts.iife.min.js     # IIFE for browser <script> tags
│   ├── react-apexcharts.min.js          # CommonJS (backward compat alias)
│   ├── react-apexcharts-server.esm.js   # react-apexcharts/server
│   ├── react-apexcharts-hydrate.esm.js  # react-apexcharts/hydrate
│   ├── react-apexcharts-core.cjs.js     # react-apexcharts/core (CJS)
│   ├── react-apexcharts-core.esm.js     # react-apexcharts/core (ESM)
│   ├── react-apexcharts-core-server.esm.js   # react-apexcharts/core/server
│   └── react-apexcharts-core-hydrate.esm.js  # react-apexcharts/core/hydrate
└── types/
    ├── react-apexcharts.d.ts
    ├── react-apexcharts-server.d.ts
    ├── react-apexcharts-hydrate.d.ts
    ├── react-apexcharts-core.d.ts
    ├── react-apexcharts-core-server.d.ts
    └── react-apexcharts-core-hydrate.d.ts
Development
Install dependencies
npm install
Running the example
Basic example including update is included to show how to get started using ApexCharts with React easily.
To run the examples,
cd example
npm install
npm run start
Bundling
To build
npm run build
License
ApexCharts is offered under a dual-license model to support individuals, startups, and commercial products of all sizes.
Read full license agreements here: https://apexcharts.com/license


评论