Systemic Risk
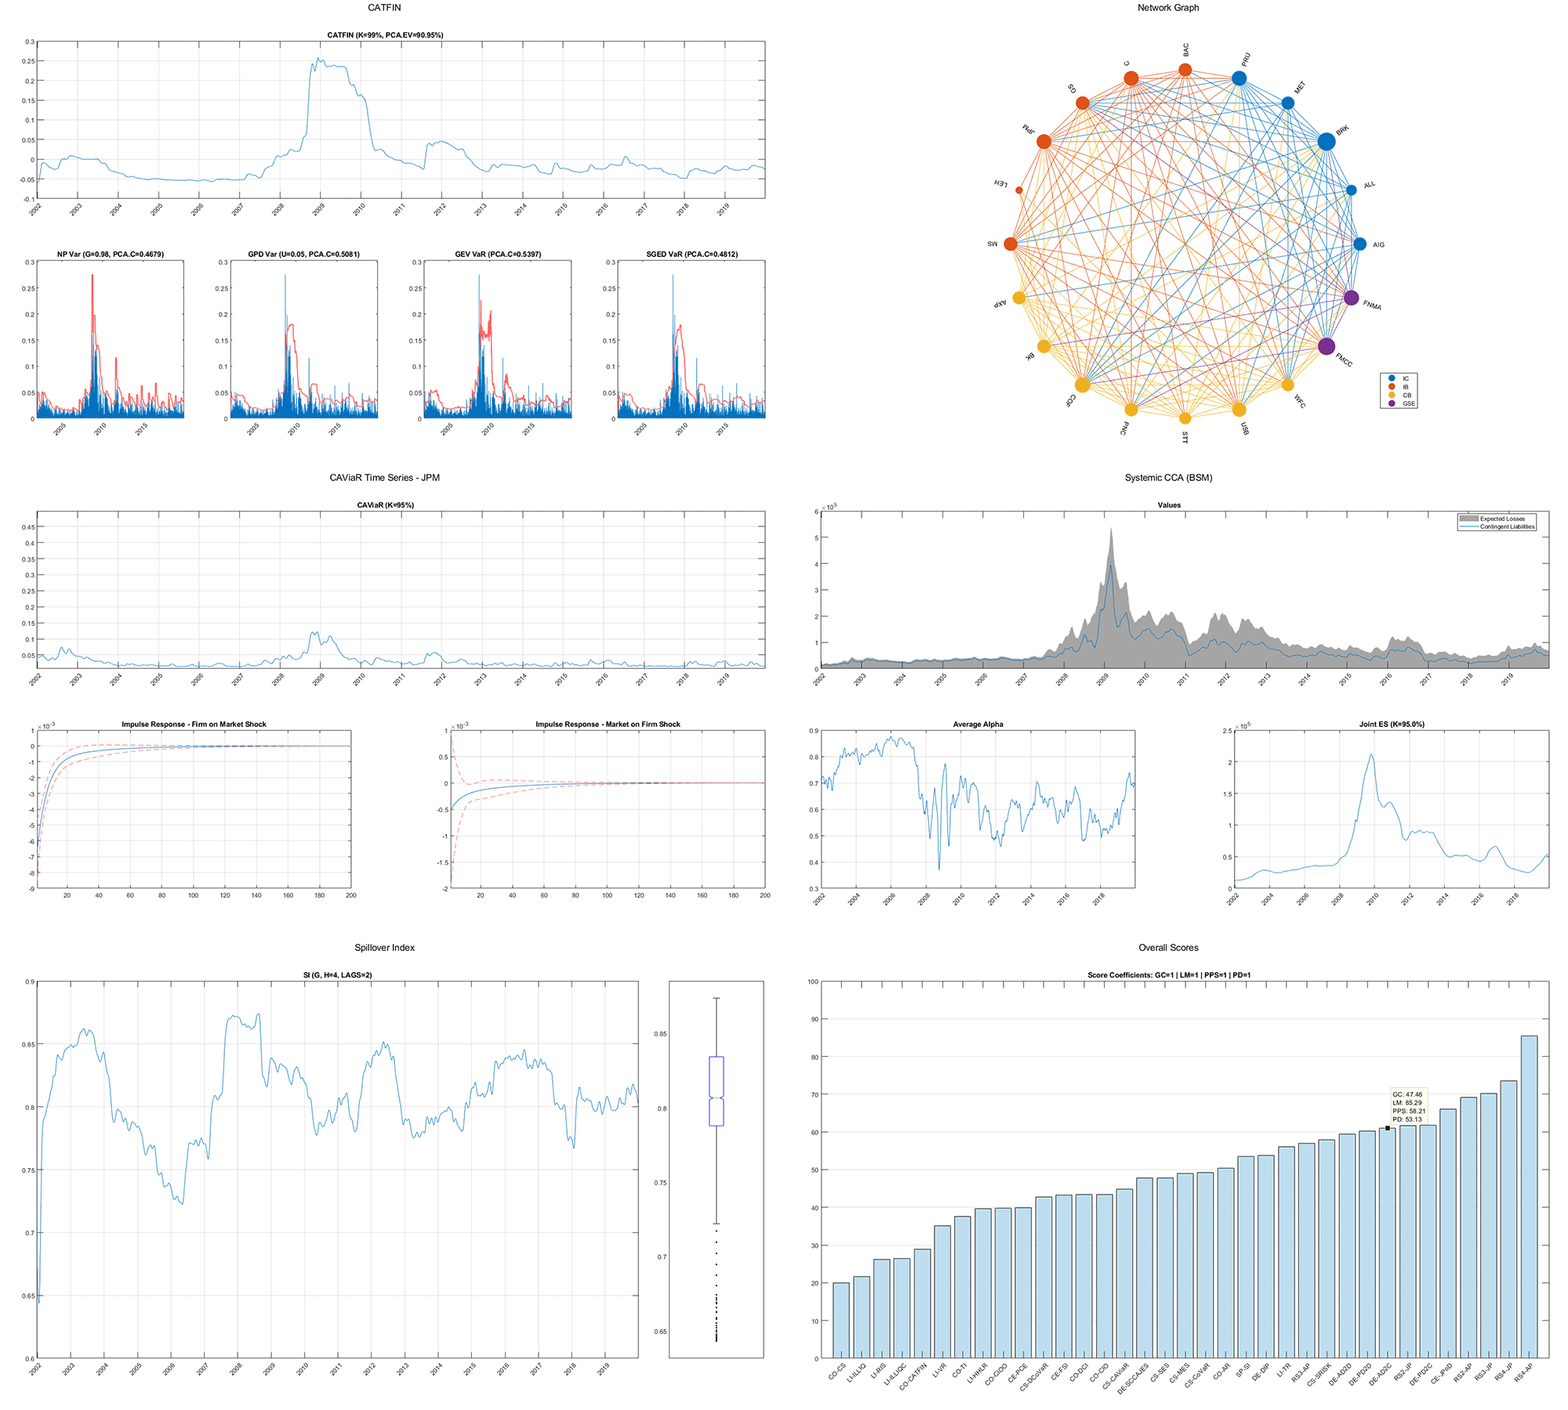
This framework calculates, analyses and compares the following systemic risk measures:
- BUBBLES DETECTION MEASURES
- COMPONENT MEASURES
- CONNECTEDNESS MEASURES
DCI (Dynamic Causality Index)CIO ("In & Out" Connections)CIOO ("In & Out - Other" Connections)Network Centralities: Betweenness, Degree, Closeness, Clustering, Eigenvector & Katz- References: Billio et al. (2011)
- CROSS-ENTROPY MEASURES
- CROSS-QUANTILOGRAM MEASURES
- CROSS-SECTIONAL MEASURES
- DEFAULT MEASURES
- LIQUIDITY MEASURES
ILLIQ (Illiquidity Measure) by Amihud (2002)RIS (Roll Implicit Spread) by Hasbrouck (2009)Classic Indicators: Hui-Heubel Liquidity Ratio, Turnover Ratio & Variance Ratio
- REGIME-SWITCHING MEASURES
2-States Model: High & Low Volatility3-States Model: High, Medium & Low Volatility4-States Model: High & Low Volatility With CorrectionsAP (Average Probability of High Volatility)JP (Joint Probability of High Volatility)- References: Billio et al. (2010), Abdymomunov (2011)
- SPILLOVER MEASURES
- TAIL DEPENDENCE MEASURES
Some of the aforementioned models have been improved or extended according to the methodologies described in the V-Lab Documentation, which represents a great source of systemic risk measurement.
The project has been published in "MATLAB Digest | Financial Services | May 2019".
If you found it useful to you, please consider making a donation to support its maintenance and development:

Requirements
The minimum required MATLAB version is R2014b. In addition, the following products and toolboxes must be installed in order to properly execute the script:
- Computer Vision System Toolbox
- Curve Fitting Toolbox
- Econometrics Toolbox
- Financial Toolbox
- Image Processing Toolbox
- Optimization Toolbox
- Parallel Computing Toolbox
- Statistics and Machine Learning Toolbox
- System Identification Toolbox
Usage
- Create a properly structured database (see the section below).
- Execute one of the following scripts (they can be edited following your needs and criteria):
run.m to perform the computation of systemic risk measures;analyze.m to analyze previously computed systemic risk measures.
Dataset
Datasets must be built following the structure of default ones included in every release of the framework (see Datasets folder). Below a list of the supported Excel sheets and their respective content:
-
Shares: prices or returns expressed in logarithmic scale of the benchmark index (the column can be labeled with any desired name and must be placed just after observation dates) and the firms, with daily frequency.
-
Volumes: trading volume of the firms expressed in currency amount, with daily frequency.
-
Capitalizations: market capitalization of the firms, with daily frequency.
-
CDS: the risk-free rate expressed in decimals (the column must be called RF and must be placed just after observation dates) and the credit default swap spreads of the firms expressed in basis points, with daily frequency.
-
Balance Sheet Components: the balance sheet components of the firms expressed in omogeneous observations frequency, currency and scale, structured as below:
- Assets: the book value of assets.
- Equity: the book value of equity.
- Separate Accounts: the separate accounts of insurance firms.
-
State Variables: systemic state variables, with daily frequency.
-
Groups: group definitions are based on three-value tuples where the Name field represents the group names, the Short Name field represents the group acronyms and the Count field represents the number of firms to include in the group. The sum of the Count fields must be equal to the number of firms. For example, the following groups definition:
Firms in the Shares Sheet: A, B, C, D, E, F, G, H
Insurance Companies: 2
Investment Banks: 2
Commercial Banks: 3
Government-sponsored Enterprises: 1
produces the following outcome:
“Insurance Companies” contains A and B
“Investment Banks” contains C and D
“Commercial Banks” contains E, F and G
“Government-sponsored Enterprises” contains H
-
Crises: crises can be defined using two different approaches:
- By Events: based on two-value tuples where the
Date field represents the event dates and the Name field represents the event names; every dataset observation matching an event date is considered to be associated to a distress occurrence.
- By Ranges: based on three-value tuples where the
Name field represents the crisis names, the Start Date field represents the crisis start dates and the End Date field represents the crisis end dates; every dataset observation falling inside a crisis range is considered to be part of a distress period.
Notes
-
The minimum allowed dataset must include the Shares sheet with a benchmark index and at least 3 firms. Observations must have a daily frequency and, in order to run consistent calculations, their minimum required amount is 253 for prices (which translates into a full business year plus an additional observation at the beginning of the time series, lost during the computation of returns) or 252 for logarithmic returns. They must have been previously validated and preprocessed by:
- discarding illiquid series (unless necessary);
- detecting and removing outliers;
- removing rows with NaNs or filling the gaps through interpolation.
-
It is not mandatory to include financial time series used by unwanted measures. Optional financial time series used by included measures can be omitted, as long as their contribution isn’t necessary. Below a list of required and optional time series for each category of measures:
- Bubbles Detection Measures:
- Required: shares (prices).
- Optional: none.
- Component Measures:
- Required: shares (any).
- Optional: none.
- Connectedness Measures:
- Required: shares (any).
- Optional: groups.
- Cross-Entropy Measures:
- Required: shares (any), cds.
- Optional: capitalizations, balance sheet, groups.
- Cross-Quantilogram Measures:
- Required: shares (any).
- Optional: state variables.
- Cross-Sectional Measures:
- Required: shares (any), capitalizations, balance sheet.
- Optional: separate accounts, state variables.
- Default Measures:
- Required: shares (any), capitalizations, cds, balance sheet.
- Optional: none.
- Liquidity Measures:
- Required: shares (prices), volumes, capitalizations.
- Optional: state variables.
- Regime-Switching Measures:
- Required: shares (any).
- Optional: none.
- Spillover Measures:
- Required: shares (any).
- Optional: none.
- Tail Dependence Measures:
- Required: shares (any).
- Optional: state variables.
-
Firms whose time series value is constantly equal to 0 in the tail, for a span that includes a customizable percentage of total observations (by default 5%), are considered to be defaulted. Firms whose Equity value is constantly negative in the tail, for a span that includes a customizable percentage of total observations (by default 5%), are considered to be insolvent. This allows the scripts to exclude them from computations starting from a certain point in time onward; defaulted firms are excluded by all the measures, insolvent firms are excluded only by SCCA default measures.
-
Once a dataset has been parsed, the script stores its output in the form of a .mat file; therefore, the parsing process is executed only during the first run. The file last modification date is taken into account by the script and the dataset is parsed once again if the Excel spreadsheet is modified.
-
The dataset parsing process might present issues related to version, bitness and regional settings of the OS, Excel and/or MATLAB. Due to the high number of users asking for help, support is no more guaranteed; the guidelines below can help solving the majority of problems:
- A bitness mismatch between the
OS and Excel may cause errors that are difficult to track. Using the same bitness for both is recommended.
- An
Excel locale other than English may produce wrong outputs related to date formats, text values and numerical values with decimals and/or thousands separators. A locale switch is recommended.
- Both
Excel 2019 and Excel 365 may present compatibility issues with MATLAB versions prior to R2019b. In later versions, the built-in function readtable may still not handle some Excel spreadsheets properly. A downgrade to Excel 2016 is recommended.
- Some
Excel spreadsheets might contain empty but defined cells in columns or rows located far away from the area in which data is stored. Those cells extend the range being read by the parser, producing false positives when checking for missing values.
- The dataset parsing process takes place inside the
ScriptsDataset\parse_dataset.m function. It is important to check the correctness of the arguments being passed to the function call. Error messages thrown by the aforementioned function are pretty straightforward and a debugging session should be enough to find the underlying causes and fix datasets and/or internal functions accordingly.
- If the dataset parsing process is too slow, the best way to speed it up is to provide a standard
Excel spreadsheet (.xlsx) with no filters and styles, or a binary Excel spreadsheet (.xlsb).
-
Some scripts may take very long time to finish in presence of huge datasets and/or extreme parametrizations. The performance of calculations may vary depending on the CPU processing speed and the number of CPU cores available for parallel computing.
Example Datasets
The Datasets folder includes many premade datasets. The main one (Example_Large.xlsx), based on the US financial sector, defines the following entities and data over a period of time ranging from 2002 to 2019 (both included):
Benchmark Index: S&P 500
Financial Institutions (20):
- Group 1: Insurance Companies (5)
- American International Group Inc. (AIG)
- The Allstate Corp. (ALL)
- Berkshire Hathaway Inc. (BRK)
- MetLife Inc. (MET)
- Prudential Financial Inc. (PRU)
- Group 2: Investment Banks (6)
- Bank of America Corp. (BAC)
- Citigroup Inc. ©
- The Goldman Sachs Group Inc. (GS)
- J.P. Morgan Chase & Co. (JPM)
- Lehman Brothers Holdings Inc. (LEH)
- Morgan Stanley (MS)
- Group 3: Commercial Banks (7)
- American Express Co. (AXP)
- Bank of New York Mellon Corp. (BK)
- Capital One Financial Corp. (COF)
- PNC Financial Services Inc. (PNC)
- State Street Corp. (STT)
- US Bancorp (USB)
- Wells Fargo & Co. (WFC)
- Group 4: Government-sponsored Enterprises (2)
- Federal Home Loan Mortgage Corp / Freddie Mac (FMCC)
- Federal National Mortgage Association / Fannie Mae (FNMA)
Risk-Free Rate: 3M Treasury Bill Rate
State Variables (8):
- FFR: the effective federal funds rate.
- TBILL_DELTA: the percent change in the 3M treasury bill rate.
- CREDIT_SPREAD: the difference between the BAA corporate bond rate and the 10Y treasury bond rate.
- LIQUIDITY_SPREAD: the difference between the 3M GC repo rate and the 3M treasury bill rate.
- TED_SPREAD: the difference between the 3M USD LIBOR rate and the 3M treasury bill rate.
- YIELD_SPREAD: the difference between the 10Y treasury bond rate and the 3M treasury bond rate.
- DJ_CA_EXC: the excess returns of the DJ US Composite Average with respect to the S&P 500.
- DJ_RESI_EXC: the excess returns of the DJ US Select Real Estate Securities Index with respect to the S&P 500.
- VIX: the implied volatility index.
Screenshots



评论