Apache License 2.0

项目介绍

OpenGeoscience/geojs 是一个托管在 GitHub 上的开源项目,主要使用 JavaScript 编写,采用 Apache License 2.0 许可证,目前获得 470 个 Star、73 次 Fork。

仓库全名
OpenGeoscience/geojs
开源许可证
Apache License 2.0
Star 数
470
Fork 数
73
未关闭 Issue
46

README 摘要

GeoJS is intended to bridge the gap between GIS, Scientific Visualization, and Infovis. GeoJS is more than just a GIS library as users can create scientific plots such as vector and contour and can embed infovis plots using D3.js. GeoJS aims for high-performance visualization and interactive data exploration of scientific and geospatial location aware datasets. GeoJS supports features such as Point, Line, Polygon,…

完整内容见 GitHub 原始 README 或本页 。

常见问题

geojs 用什么语言开发?

主要使用 JavaScript 编写,采用 Apache License 2.0 许可证,目前有 470 个 Star。

geojs 可以免费商用吗?

仓库采用 Apache License 2.0 许可证,可免费使用与修改,商业使用请遵守许可证条款(例如保留版权声明与许可声明)。

如何获取 geojs 的源码?

可以直接克隆仓库:git clone https://github.com/OpenGeoscience/geojs.git,默认分支为 master;安装与运行步骤见仓库 README。

geojs 最近还在维护吗?

仓库最近一次更新为 5 天前,当前有 46 个未关闭 Issue;Star 数为 470,可作为社区活跃度的参考。

关于

GitHub 原始描述(英文)

High-performance visualization and interactive data exploration of scientific and geospatial location aware datasets

描述取自 GitHub 官方 API,保持仓库作者书写的原文。

语言占比

CSS
EJS
GLSL
Go Template
HTML
JavaScript
Pug
Python
SCSS
Stylus

Release

README

GeoJS

Build Status codecov.io DOI npm published version

GeoJS is intended to bridge the gap between GIS, Scientific Visualization, and Infovis. GeoJS is more than just a GIS library as users can create scientific plots such as vector and contour and can embed infovis plots using D3.js. GeoJS aims for high-performance visualization and interactive data exploration of scientific and geospatial location aware datasets.

GeoJS supports features such as Point, Line, Polygon, and advanced features such as Pixelmap, Contour, Heatmap, and Choropleth.

GeoJS can read and render data from GeoJSON files, and WMS servers. Additional features includes Annotations, Legends, Animated Transitions, and Widgets.

GeoJS can also be used for visualizing medical imagery. See Digital Slide Archive for an example.

Examples

For live examples visit Github.io

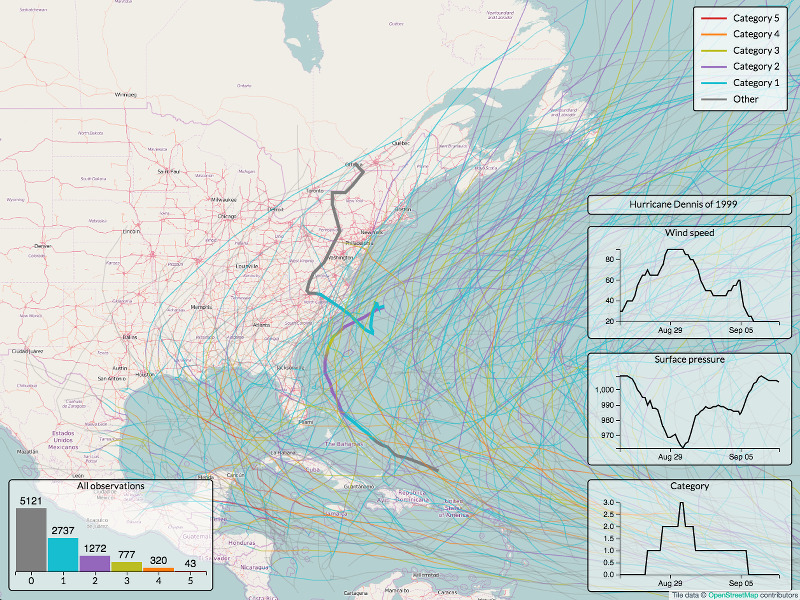
Historical hurricane data Visualization in GeoJS

Documentation

You can find more information on GeoJS installation and usage in our Documentation.

There are some additional resources:

Support

We would love to get your feedback and bug reports. Please use GitHub issues.

Get Involved

We are open for collaboration. Kitware has been doing open source development for the last 20 year and understands and appreciates what it takes to develop open source software.

GeoJS has been used in various Girder based applications such as Dansfield-App and DIVE.

评论

暂无评论