







Get in Touch!


Youtube Tutorial on GSTools

Purpose

GSTools provides geostatistical tools for various purposes:
- random field generation, including periodic boundaries
- simple, ordinary, universal and external drift kriging
- conditioned field generation
- incompressible random vector field generation
- (automated) variogram estimation and fitting
- directional variogram estimation and modelling
- data normalization and transformation
- many readily provided and even user-defined covariance models
- metric spatio-temporal modelling
- plurigaussian field simulations (PGS)
- collocated cokriging
- plotting and exporting routines
Installation
conda
GSTools can be installed via conda on Linux, Mac, and Windows.
Install the package by typing the following command in a command terminal:
conda install gstools
In case conda forge is not set up for your system yet, see the easy to follow
instructions on conda forge.
pip
GSTools can be installed via pip on Linux, Mac, and Windows.
On Windows you can install WinPython to get Python and pip
running. Install the package by typing the following command in a command terminal:
pip install gstools
To install the latest development version via pip, see the
documentation.
uv
GSTools can be installed via uv on Linux, Mac, and Windows.
Install the package by typing the following command in a command terminal:
uv add gstools
To install the latest development version via uv, see the
documentation.
Citation
If you are using GSTools in your publication please cite our paper:
Müller, S., Schüler, L., Zech, A., and Heße, F.:
GSTools v1.3: a toolbox for geostatistical modelling in Python,
Geosci. Model Dev., 15, 3161–3182, https://doi.org/10.5194/gmd-15-3161-2022, 2022.
You can cite the Zenodo code publication of GSTools by:
Sebastian Müller & Lennart Schüler. GeoStat-Framework/GSTools. Zenodo. https://doi.org/10.5281/zenodo.1313628
If you want to cite a specific version, have a look at the Zenodo site.
You can find the documentation under geostat-framework.readthedocs.io.
Tutorials and Examples
The documentation also includes some tutorials, showing the most important use cases of GSTools, which are
The associated python scripts are provided in the examples folder.
Spatial Random Field Generation
The core of this library is the generation of spatial random fields. These fields are generated using the randomisation method, described by Heße et al. 2014.
Examples
Gaussian Covariance Model
This is an example of how to generate a 2 dimensional spatial random field with a gaussian covariance model.
import gstools as gs
# structured field with a size 100x100 and a grid-size of 1x1
x = y = range(100)
model = gs.Gaussian(dim=2, var=1, len_scale=10)
srf = gs.SRF(model)
srf((x, y), mesh_type='structured')
srf.plot()

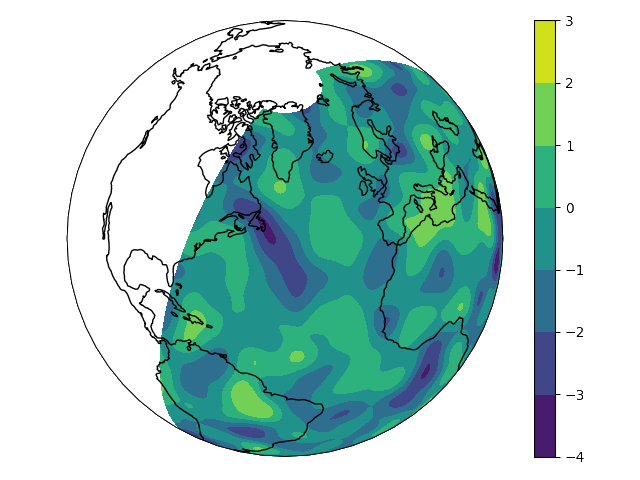
GSTools also provides support for geographic coordinates.
This works perfectly well with cartopy.
import matplotlib.pyplot as plt
import cartopy.crs as ccrs
import gstools as gs
# define a structured field by latitude and longitude
lat = lon = range(-80, 81)
model = gs.Gaussian(latlon=True, len_scale=777, geo_scale=gs.KM_SCALE)
srf = gs.SRF(model, seed=12345)
field = srf.structured((lat, lon))
# Orthographic plotting with cartopy
ax = plt.subplot(projection=ccrs.Orthographic(-45, 45))
cont = ax.contourf(lon, lat, field, transform=ccrs.PlateCarree())
ax.coastlines()
ax.set_global()
plt.colorbar(cont)
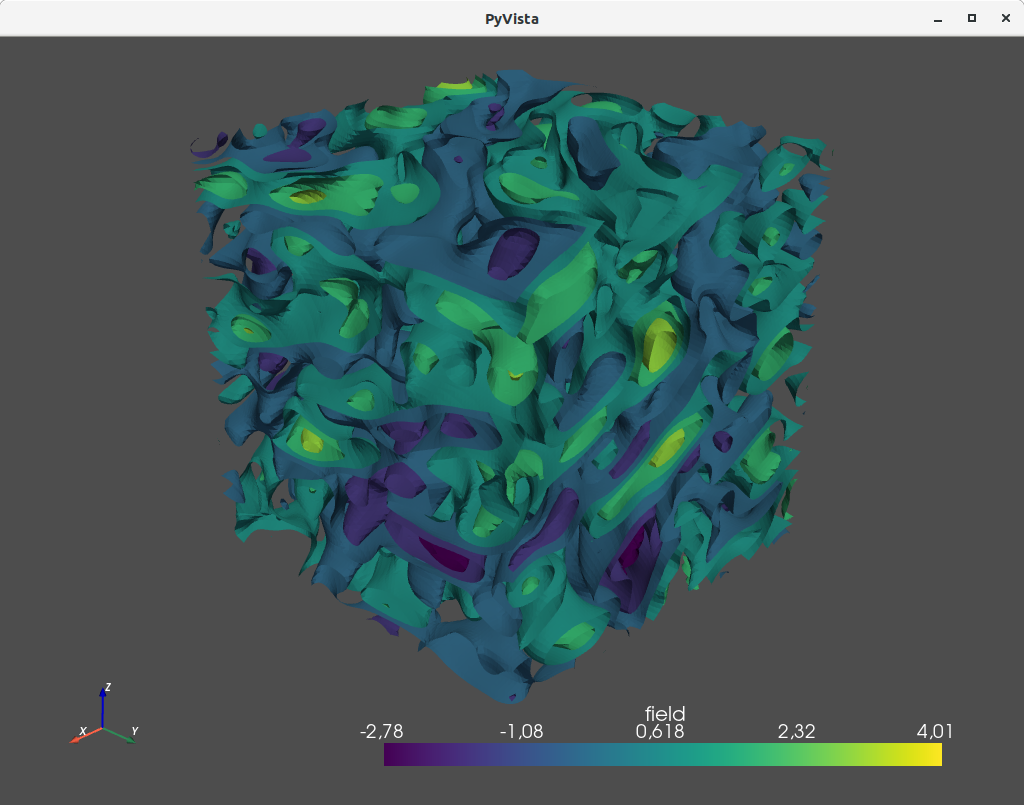
A similar example but for a three dimensional field is exported to a VTK file, which can be visualized with ParaView or PyVista in Python:
import gstools as gs
# structured field with a size 100x100x100 and a grid-size of 1x1x1
x = y = z = range(100)
model = gs.Gaussian(dim=3, len_scale=[16, 8, 4], angles=(0.8, 0.4, 0.2))
srf = gs.SRF(model)
srf((x, y, z), mesh_type='structured')
srf.vtk_export('3d_field') # Save to a VTK file for ParaView

mesh = srf.to_pyvista() # Create a PyVista mesh for plotting in Python
mesh.contour(isosurfaces=8).plot()
Estimating and Fitting Variograms
The spatial structure of a field can be analyzed with the variogram, which contains the same information as the covariance function.
All covariance models can be used to fit given variogram data by a simple interface.
Example
This is an example of how to estimate the variogram of a 2 dimensional unstructured field and estimate the parameters of the covariance
model again.
import numpy as np
import gstools as gs
# generate a synthetic field with an exponential model
x = np.random.RandomState(19970221).rand(1000) * 100.
y = np.random.RandomState(20011012).rand(1000) * 100.
model = gs.Exponential(dim=2, var=2, len_scale=8)
srf = gs.SRF(model, mean=0, seed=19970221)
field = srf((x, y))
# estimate the variogram of the field
bin_center, gamma = gs.vario_estimate((x, y), field)
# fit the variogram with a stable model. (no nugget fitted)
fit_model = gs.Stable(dim=2)
fit_model.fit_variogram(bin_center, gamma, nugget=False)
# output
ax = fit_model.plot(x_max=max(bin_center))
ax.scatter(bin_center, gamma)
print(fit_model)
Which gives:
Stable(dim=2, var=1.85, len_scale=7.42, nugget=0.0, anis=[1.0], angles=[0.0], alpha=1.09)

Kriging and Conditioned Random Fields
An important part of geostatistics is Kriging and conditioning spatial random
fields to measurements. With conditioned random fields, an ensemble of field realizations with their variability depending on the proximity of the measurements can be generated.
Example
For better visualization, we will condition a 1d field to a few “measurements”, generate 100 realizations and plot them:
import numpy as np
import matplotlib.pyplot as plt
import gstools as gs

# conditions
cond_pos = [0.3, 1.9, 1.1, 3.3, 4.7]
cond_val = [0.47, 0.56, 0.74, 1.47, 1.74]

# conditioned spatial random field class
model = gs.Gaussian(dim=1, var=0.5, len_scale=2)
krige = gs.krige.Ordinary(model, cond_pos, cond_val)
cond_srf = gs.CondSRF(krige)
# same output positions for all ensemble members
grid_pos = np.linspace(0.0, 15.0, 151)
cond_srf.set_pos(grid_pos)

# seeded ensemble generation
seed = gs.random.MasterRNG(20170519)
for i in range(100):
    field = cond_srf(seed=seed(), store=f"field_{i}")
    plt.plot(grid_pos, field, color="k", alpha=0.1)
plt.scatter(cond_pos, cond_val, color="k")
plt.show()

User Defined Covariance Models
One of the core-features of GSTools is the powerful
CovModel
class, which allows to easy define covariance models by the user.
Example
Here we re-implement the Gaussian covariance model by defining just a
correlation function, which takes a non-dimensional distance h = r/l:
import numpy as np
import gstools as gs
# use CovModel as the base-class
class Gau(gs.CovModel):
    def cor(self, h):
        return np.exp(-h**2)
And that’s it! With Gau you now have a fully working covariance model,
which you could use for field generation or variogram fitting as shown above.
Have a look at the documentation for further information on incorporating
optional parameters and optimizations.
Incompressible Vector Field Generation
Using the original Kraichnan method, incompressible random
spatial vector fields can be generated.
Example
import numpy as np
import gstools as gs
x = np.arange(100)
y = np.arange(100)
model = gs.Gaussian(dim=2, var=1, len_scale=10)
srf = gs.SRF(model, generator='VectorField', seed=19841203)
srf((x, y), mesh_type='structured')
srf.plot()
yielding

Plurigaussian Field Simulation (PGS)
With PGS, more complex categorical (or discrete) fields can be created.
Example
import gstools as gs
import numpy as np
import matplotlib.pyplot as plt

N = [180, 140]

x, y = range(N[0]), range(N[1])

# we need 2 SRFs
model = gs.Gaussian(dim=2, var=1, len_scale=5)
srf = gs.SRF(model)
field1 = srf.structured([x, y], seed=20170519)
field2 = srf.structured([x, y], seed=19970221)

# with `lithotypes`, we prescribe the categorical data and its relations
# here, we use 2 categories separated by a rectangle.
rect = [40, 32]
lithotypes = np.zeros(N)
lithotypes[
    N[0] // 2 - rect[0] // 2 : N[0] // 2 + rect[0] // 2,
    N[1] // 2 - rect[1] // 2 : N[1] // 2 + rect[1] // 2,
] = 1

pgs = gs.PGS(2, [field1, field2])
P = pgs(lithotypes)

fig, axs = plt.subplots(1, 2)
axs[0].imshow(lithotypes, cmap="copper")
axs[1].imshow(P, cmap="copper")
plt.show()

VTK/PyVista Export
After you have created a field, you may want to save it to file, so we provide
a handy VTK export routine using the .vtk_export() or you could
create a VTK/PyVista dataset for use in Python with to .to_pyvista() method:
import gstools as gs
x = y = range(100)
model = gs.Gaussian(dim=2, var=1, len_scale=10)
srf = gs.SRF(model)
srf((x, y), mesh_type='structured')
srf.vtk_export("field") # Saves to a VTK file
mesh = srf.to_pyvista() # Create a VTK/PyVista dataset in memory
mesh.plot()
Which gives a RectilinearGrid VTK file field.vtr or creates a PyVista mesh
in memory for immediate 3D plotting in Python.

Requirements:
Optional
You can contact us via [email protected].
License
LGPLv3 © 2018-2025





评论